library(shiny)
library(shinydashboard)
library(tools) #to check file extension
library(dplyr) #select_if()
library(readxl)
scatter_ui=fluidPage(
title="scatter",
sidebarLayout(
sidebarPanel(
fileInput(inputId = "file_scatter", label = "Select Dataset",
accept = c("text/csv","text/comma-separated-values,
text/plain",".csv",".xlsx"),
buttonLabel = "Browse...",
placeholder = "No file selected"),
selectInput(inputId = "scatter_var1_id",
label = "Select x variable",
choices=""),
selectInput(inputId = "scatter_var2_id",
label = "Select y variable",
choices="")
),
mainPanel (plotOutput("scatter"))
))
header = dashboardHeader()
sidebar=dashboardSidebar(
sidebarMenu(
id = "tabs",
menuItem("Graph", tabName = "graph",
menuSubItem("Scatter Plot", tabName = "Scatter-Plot")
)
)
)
body=dashboardBody(
tabItems(
tabItem("Scatter-Plot",scatter_ui)
)
)
ui = dashboardPage(
title = "Web App With Shiny",
header,
sidebar,
body
)
update_input= function(input_id,label,data){
return(
updateSelectInput(
session = getDefaultReactiveDomain(),
inputId = input_id,
label = label,
choices = names(data()),
selected = NULL
) )
}
server= function(input,output){
data_scatter=reactive({
req(input$file_scatter)
file_ext= file_ext(input$file_scatter$datapath)
if(file_ext=="xlsx"|file_ext=="xls"){
df=as.data.frame(read_excel(input$file_scatter$datapath))
}
else{
df = read.csv(input$file_scatter$datapath )
}
return(select_if(df, is.numeric))
})
observe(update_input("scatter_var1_id",label="select X variable",data_scatter))
observe(update_input("scatter_var2_id",label="select Y variable",data_scatter))
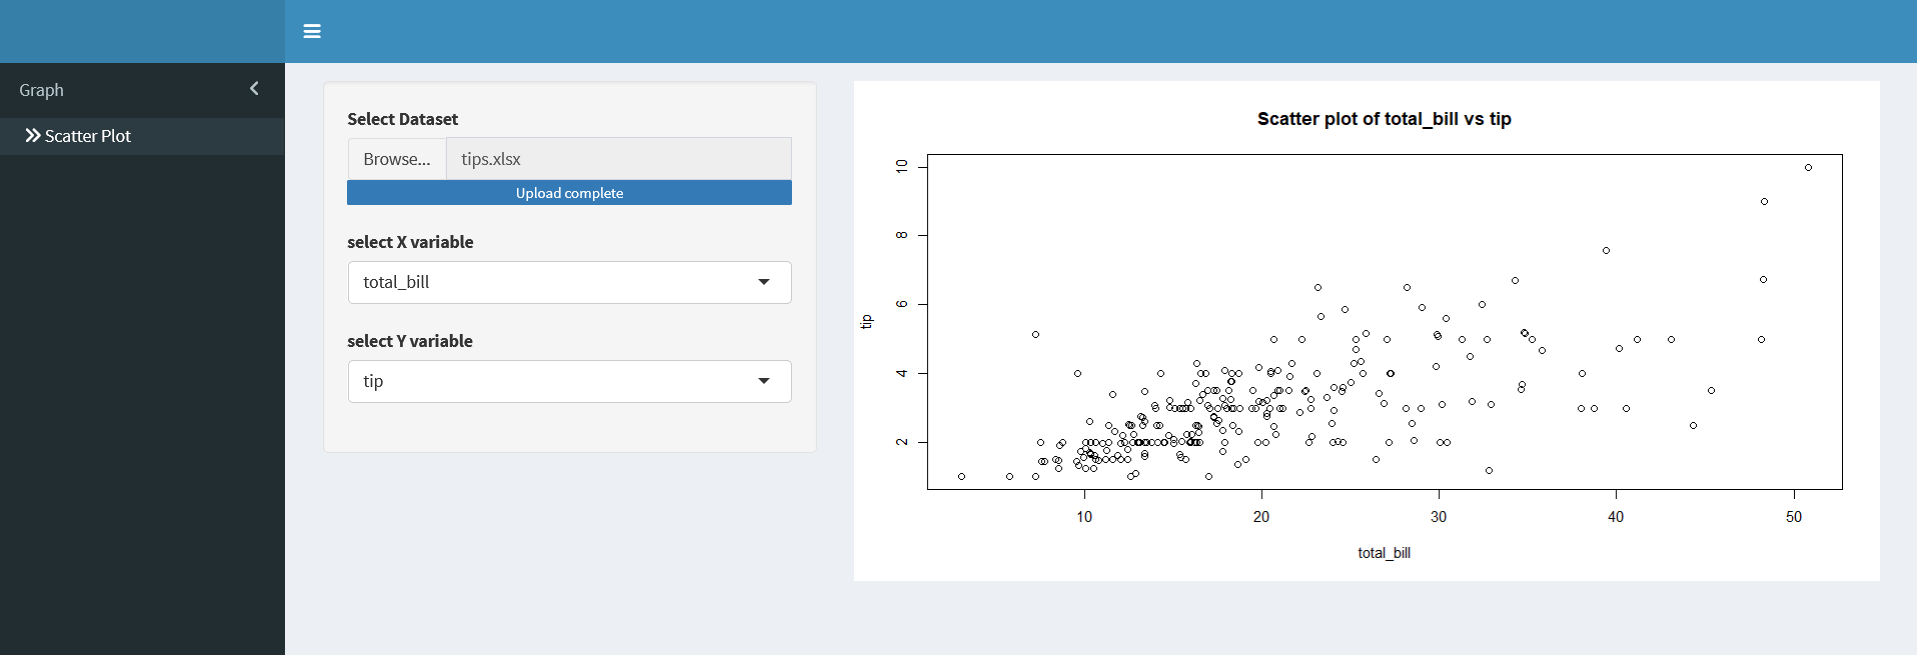
output$scatter = renderPlot({
x = data_scatter()[,input$scatter_var1_id]
y=data_scatter()[,input$scatter_var2_id]
plot(x,y,xlab=input$scatter_var1_id,ylab=input$scatter_var2_id,
main = paste("Scatter plot of" ,input$scatter_var1_id,"vs",
input$scatter_var2_id))
}
)
}
shinyApp(ui,server)