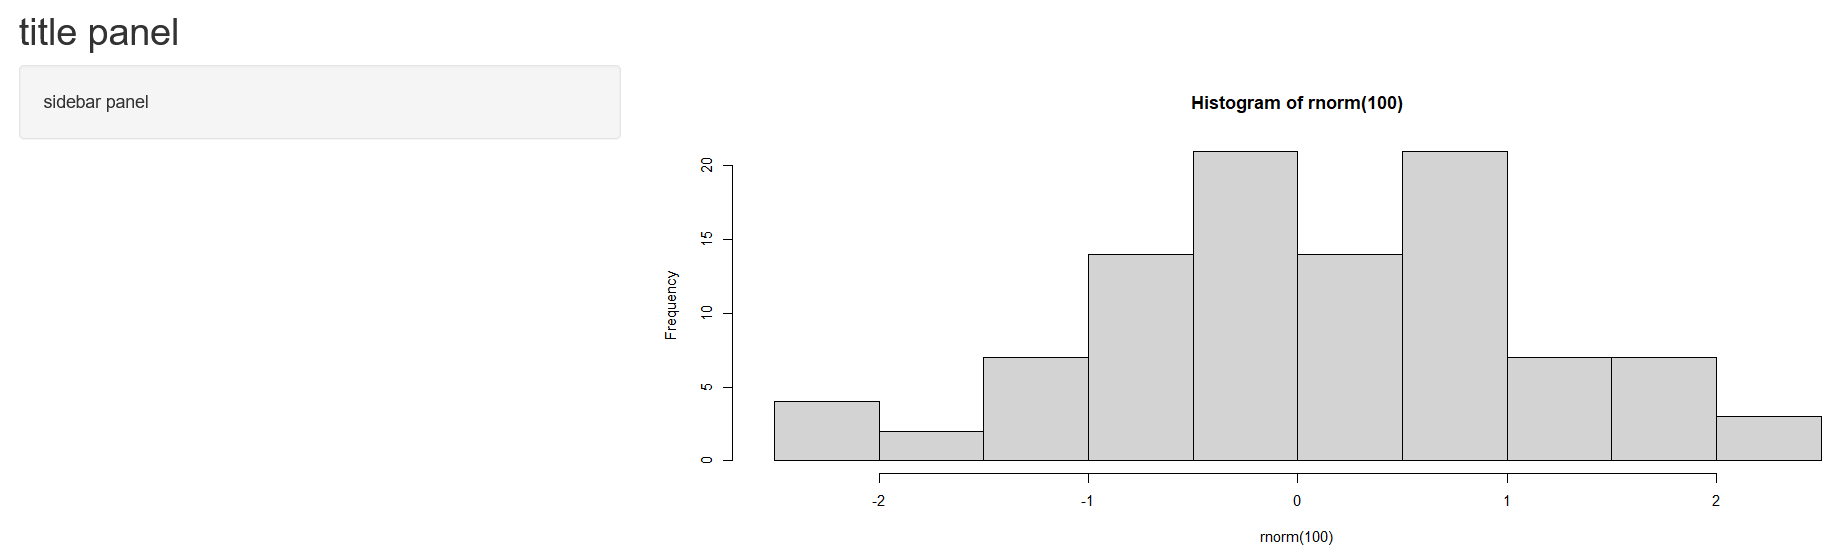
Display output
  library(shiny)

  ui = fluidPage(

            titlePanel("title panel"),

            sidebarLayout(

                sidebarPanel("sidebar panel"),
                mainPanel(plotOutput('graph'))

                         )
                )

  server=function(input,output){
                output$graph=renderPlot({hist(rnorm(100))})
               }

  shinyApp(ui, server)
Display reactive output
  library(shiny)

  ui = fluidPage(
     titlePanel("title panel"),
     sidebarLayout(
      sidebarPanel("sidebar panel",
                   numericInput(inputId = "n",label = "Enter Sample Size :",value = 50)),
      mainPanel(plotOutput('graph'))
    )
  )

  server=function(input,output){
    size= reactive({input$n})
    output$graph=renderPlot({hist(rnorm(size()))})
  }

  shinyApp(ui, server)
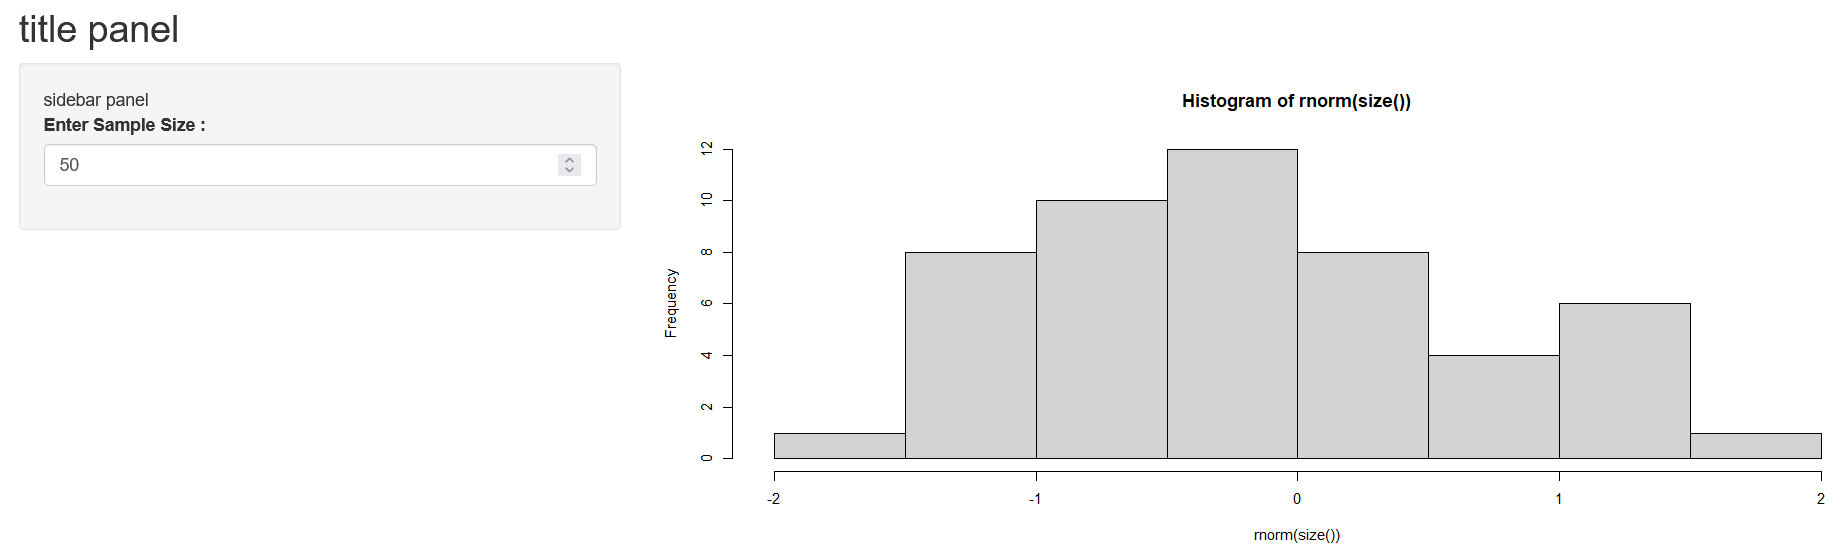
here histogram is depend on sample size and sample size is in user's hand it could be anything 10,30,100,500,...so we will write it in reactive({}) function Whenever User update the sample size plot will be re render. Now this time entire file will not run again Whenever changes happens only that part will be run again. this is the power of reactive function and it help to improve speed of app.